 Earn Money Forex Best Forex Trading Experience


Bollinger Bands Strategies (Part-8)
Friends…….
A lot of thanks for visit earnmoneyfx.com
As a series part strategy of Bollinger Bands Strategy, earnmoneyfx.com research team
suggests you to follow various type entry-exit strategies of Bollinger Bandsas below:
1. Candlesticks Pattern with Bollinger Bands
2. Double Top Chart Pattern with Bollinger Bands
3. Double Bottom Chart Pattern with Bollinger Bands
4. Reversal or Counter Candlesticks with Bollinger Bands
5. Trend line Breakout with Bollinger Bands
6. Swing Trading with Middle Bands (20 Simple Moving Average) Bollinger Bands
7. Walking with Bollinger Bands
8. Ascending Triangle with Bollinger Bands
9. Descending Triangle with Bollinger Bands
10. Symmetrical Triangle with Bollinger Bands
11. Flag Pattern with Bollinger Bands
12. Channel with Bollinger Bands
13. Candlesticks Pattern with Bollinger Bands
14. Golden Cross with Bollinger Bands
15. Death Cross with Bollinger Bands
16. Short term & Mid term moving average cross with Bollinger Bands
17. Multi time frame analysis with Bollinger Bands
18. 200 Simple Moving Average with Bollinger Bands etc.
Bollinger Bands Entry-Exit Strategy (Part -1) we have discussed about Candlesticks
Pattern with Bollinger Bands and Double Top Chart Pattern with Bollinger Bands
Above link is for your ready references.
Bollinger Brand Entry-Exit Strategy (Part -2) we have discussed about Double Bottom
Chart Pattern with Bollinger Bands and Reversal or Counter Candlesticks with
Bollinger Bands.
Above link is for your ready references.
Bollinger Brand Entry-Exit Strategy (Part -3) we have discussed about Trend line
Breakout with Bollinger Bands
Above link is for your ready references.
Bollinger Brand Entry-Exit Strategy (Part -4) we have discussed about Swing Trading with
Middle Bands (20 Simple Moving Average) Bollinger Bands
Above link is for your ready references.
Bollinger Brand Entry-Exit Strategy (Part -5) we have discussed about 200 Simple Moving
Average with Bollinger Bands
Above link is for your ready references.
Bollinger Bands Entry-Exit Strategy (Part -6) we have discussed about Walking with
Bollinger Bands.
Above link is for your ready references.
Bollinger Bands Entry-Exit Strategy (Part -7)
we have discussed about Ascending Triangle
with Bollinger Brand Entry-Exit Strategy, Descending Triangle with Bollinger Bands
Entry-Exit Strategy and Symmetrical Triangle with Bollinger Bands Entry-Exit
Strategy.
Above link is for your ready references.
If you missed all or anyone, Earnest request you to visit Bollinger Bands Entry-Exit
Strategy (Part -1), Bollinger Bands Entry-Exit Strategy (Part -2), Bollinger Brand Entry-Exit
Strategy (Part -3), Bollinger Bands Entry-Exit Strategy (Part -4), Bollinger Bands Entry-Exit
Strategy (Part -5), Bollinger Bands Entry-Exit Strategy (Part -6) and Bollinger Bands Entry
Exit Strategy (Part -7) in earnmoneyfx.com
These article earnmoneyfx.com research teams try to cover another strategy as below.
*** Flag pattern with Bollinger Bands Entry-Exit Strategy ***
*** Channel with Bollinger Bands Entry-Exit Strategy ***
As per earnmonreyfx.com research team demo test, this strategy works well any
timeframe and any pair.
For good success rate we suggest you One Hourly, Four Hourly, Daily timeframe and major
pair (EURUSD, GBPUSD, AUDUSD, NZDUSD, USDCHF, USDCAD, USDJPY, EURJPY,
GBPJPY), XAUUSD, XAUEUR, CRUIDE OIL and S&P500
Let’s explore all ……….
For your soft reminder, Before enter deep discussion about Bollinger Bands strategy, its
important us to know what is Bollinger Bands and How to calculate Bollinger Bands
What is Bollinger Bands?
Bollinger Bands was developed by John Bollinger. Bollinger Bands® is a registered
trademark by John Bollinger.
Bollinger Bands is very simple. It has three parts. Upper Bands, Middle Bands and Lower
Bands.
Upper Bands and Lower Bands are volatility based Bands. Volatility based on standard
deviation. By using standard deviation volatility increase and decrease. Usually standard
deviation 2 set in upper Bands and lower Bands.
When volatility increases the band automatically widen and when volatility decreases the
band automatically contract.
Middle Bands is 20 Simple Moving Average. Simple Moving Average use the standard
deviation formula thus 20 Simple Moving Average use Bollinger Bands as a middle brand.
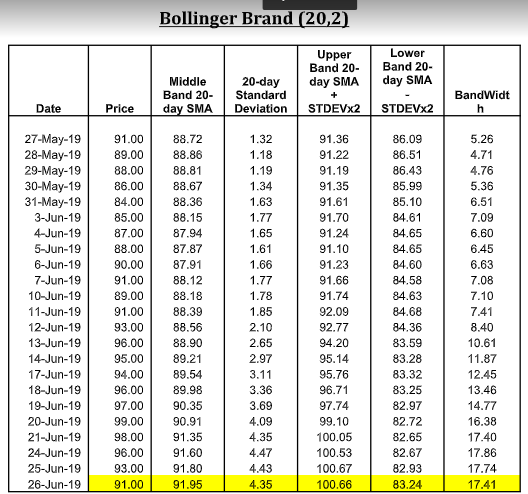
Calculation of Bollinger Bands:
* Middle Band = 20-day simple moving average (SMA)
* Upper Band = 20-day SMA + (20-day standard deviation of price x 2)
Please note, Bollinger Bands (20,2) is build in setup by Jhon Bollinger. But its not
mandatory to setup by build. You can change as your choice. But one thing you have to
know that most of trader setup Bollinger Brand as a build in thus its show buy or signal
similarly most of trader. If you want to change build in setup, at first you have to specialists
in Bollinger Bands strategies. Otherwise more chance to hit stop loss. It will be best if you
with crowd.
As per John Bollinger suggestion,
You can set standard deviation multiplier 2, where simple moving average is 20 and
standard deviation value is 20.
You can set standard deviation multiplier 2.1, where simple moving average is 50 and
standard deviation value is 50.
You can set standard deviation multiplier 1.9, where simple moving average is 10 and
standard deviation value is 10.
How to set up Bollinger Bands in Metatrader4:
Open Metatrader4 > Insert > Indicator > Trend > Bollinger Bands
Let’s explore ……….
Flag pattern with Bollinger Bands Entry-Exit Strategy:
Before explore Flag pattern with Bollinger Bands Entry-Exit Strategy at first we learn to
know what Ascending Triangle is.
What is Flag Pattern: The Flag Pattern is actually continuation pattern. Basically Flag
Pattern find out in chart after massive or big bullish or bearish movement. Research has
shown that Flag Pattern is some of the most reliable continuation pattern.
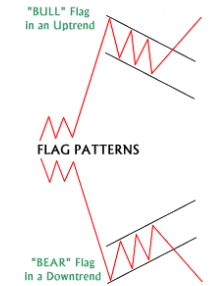
As above image of Flag Pattern we found below things.
Bullish Flag maintain lower tops and lower bottoms. Also the pattern goes against up
trend but the channel go ahead with parallel.
Bearish Flag maintain higher tops and higher bottoms. Also the pattern goes against
down trend but the channel go ahead with parallel.
Minimum two lower tops and two lower bottoms required for create bullish flag
pattern .
Minimum two higher tops and two higher bottoms required for create bearish
flag pattern .
Image 1: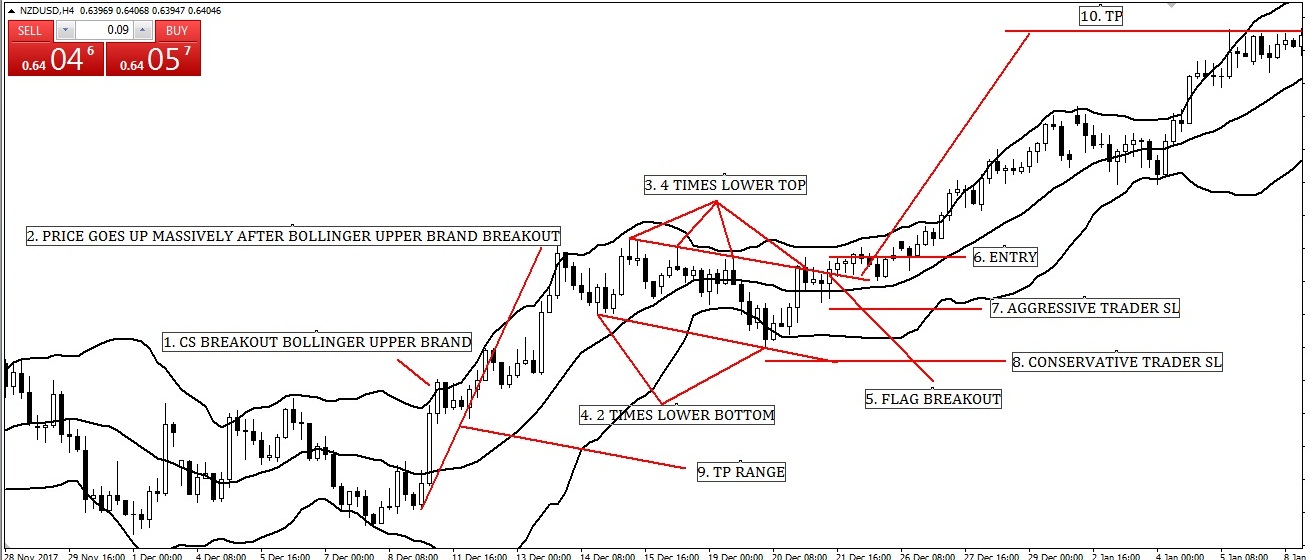
Bullish Flag Pattern with Bollinger Bands Entry-Exit Strategy
Image point number – 1, We see candlesticks breakout Bollinger Upper Bands. That
means its uptrend. Also its time to wait and watch as per Bullish Flag Pattern with Bollinger
Bands Entry-Exit Strategy rules.
Image point number – 2, Strong uptrend created where price goes up massively.
Image point number – 3, After strong uptrend price gone to correction. Price created four
times lower tops but failure to breakout.
Image point number – 4, Price created two times lower bottom. We concretely found
bullish flag pattern in chart. Now we have to wait for breakout.
Image point number – 5, At last price breakout bullish flag pattern. As per Bullish Flag
Pattern with Bollinger Bands Entry-Exit Strategy rules its time to buy. But we have to wait
for candlesticks close above channel. which indicate successful. breakout.
Image point number – 6, Aggressive or conservative trader put their BUY STOP order 2
pips above of Bullish Flag Pattern breakout candlesticks.
Image point number – 7, After hit BUY STOP order aggressive trader place STOP LOSS 2
pips below of Bullish Flag Pattern breakout candlesticks.
Image point number – 8, Conservative traders place STOP LOSS 2 pips below of Bullish
Flag Pattern lower channel.
Image point number – 9, As per Bullish Flag Pattern exit rules, we measure take profit
range.
Image point number – 10, Conservative or aggressive trader place their take profit level
on Bullish Flag Pattern take profit range or near swing high or 1 : 2 or 1 : 3 risk reward
ratio.
Image 2: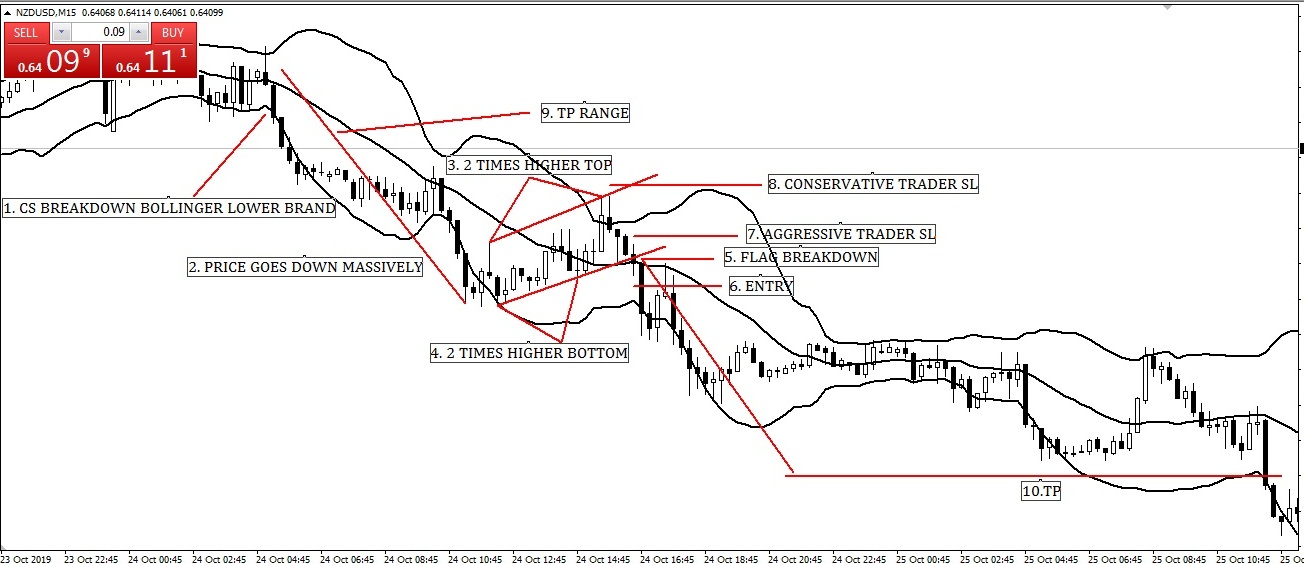
Bearish Flag Pattern with Bollinger Bands Entry-Exit Strategy
Image point number – 1, We see candlesticks break down Lower Bands of Bollinger. That
means its down trend. Also its time to wait and watch as per Bearish Flag Pattern with
Bollinger Bands Entry-Exit Strategy rules.
Image point number – 2, Strong down trend created where price goes down massively.
Image point number – 3, After strong down trend price gone to reversal. Price created
two times higher top.
Image point number – 4, Price created two times higher bottom. We concretely found
bullish flag pattern in chart. Now we have to wait for break down.
Image point number – 5, At last price break down bearish flag pattern. As per Bearish
Flag Pattern with Bollinger Brand Entry Exit Strategy rules its time to sell. But we have to
wait for candlesticks close below channel which indicate successful break down.
Image point number – 6, Aggressive or conservative trader put their SELL STOP order 2
pips below of Bearish Flag Pattern break down candlesticks.
Image point number – 7, After hit SELL STOP order aggressive trader place STOP LOSS 2
pips above of Bearish Flag Pattern break down candlesticks.
Image point number – 8, Conservative traders place STOP LOSS 2 pips above of Bearish
Flag Pattern lower channel.
Image point number – 9, As per Bearish Flag Pattern exit rules, we measure take profit
range.
Image point number – 10, Conservative or aggressive trader place their take profit level
on Bearish Flag Pattern take profit range or near swing high or 1 : 2 or 1 : 3 risk reward
ratio.
Channel pattern with Bollinger Bands Entry-Exit Strategy:
Before explore Channel pattern with Bollinger Bands Entry-Exit Strategy at first we
learn to know what is Channel pattern.
What is Channel Pattern: Channel Pattern is actually continuation. pattern. It’s also
indecision. area. Basically Channel Pattern find. out in chart after massive or big bullish or
bearish movement. Research has shown that Channel Pattern is some of the most reliable
continuation patterns Of course. trend lines run parallel. Supply and demand seems
balanced at the moment. Buyers and sellers also seem equally.
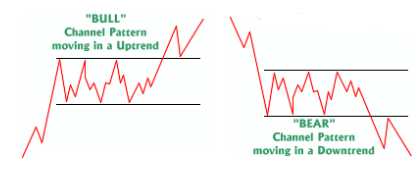
As above image of Channel Pattern we found below things.
Bullish channel maintain parallel tops and parallel bottoms. Also the pattern goes
against up trend but the channel goes ahead with parallel.
Bearish channel maintain parallel tops and parallel bottoms. Also the pattern goes
against down trend but the channel goes ahead with parallel.
Minimum two parallel tops and two parallel bottoms required for create bullish
channel pattern.
Minimum two parallel tops and two parallel bottoms required for create bearish
channel pattern.
Image 3:
Bullish Channel Pattern with Bollinger Bands Entry-Exit Strategy
Image point number – 1, We see candlesticks sideways. Also its time to wait and watch as
per Bullish channel Pattern with Bollinger Brand Entry-Exit Strategy rules.
Image point number – 2, Strong uptrend created where price goes up massively.
Image point number – 3, After strong uptrend price gone to correction. Price created two
times equal tops but failure to breakout.
Image point number – 4, Price created two times equal bottom. We concretely found
bullish channel pattern in chart. Now we have to wait for breakout.
Image point number – 5, At last price breakout bullish channel pattern. As per Bullish
channel Pattern with Bollinger Brand Entry-Exit Strategy rules its time to buy. But we have
to wait for candlesticks close above channel. which indicate successful. breakout.
Image point number – 6, Aggressive or conservative trader put their BUY STOP order 2
pips above of Bullish channel Pattern breakout candlesticks.
Image point number – 7, After hit BUY STOP order aggressive trader place STOP LOSS 2
pips below of Bullish channel Pattern breakout candlesticks.
Image point number – 8, Conservative traders place STOP LOSS 2 pips below of Bullish
channel Pattern lower channel.
Image point number – 9, As per Bullish channel Pattern exit rules, we measure take profit
range.
Image point number – 10, Conservative or aggressive trader place their take profit level
on Bullish channel Pattern take profit range or near swing high or 1 : 2 or 1 : 3 risk reward
ratio.
Image 4: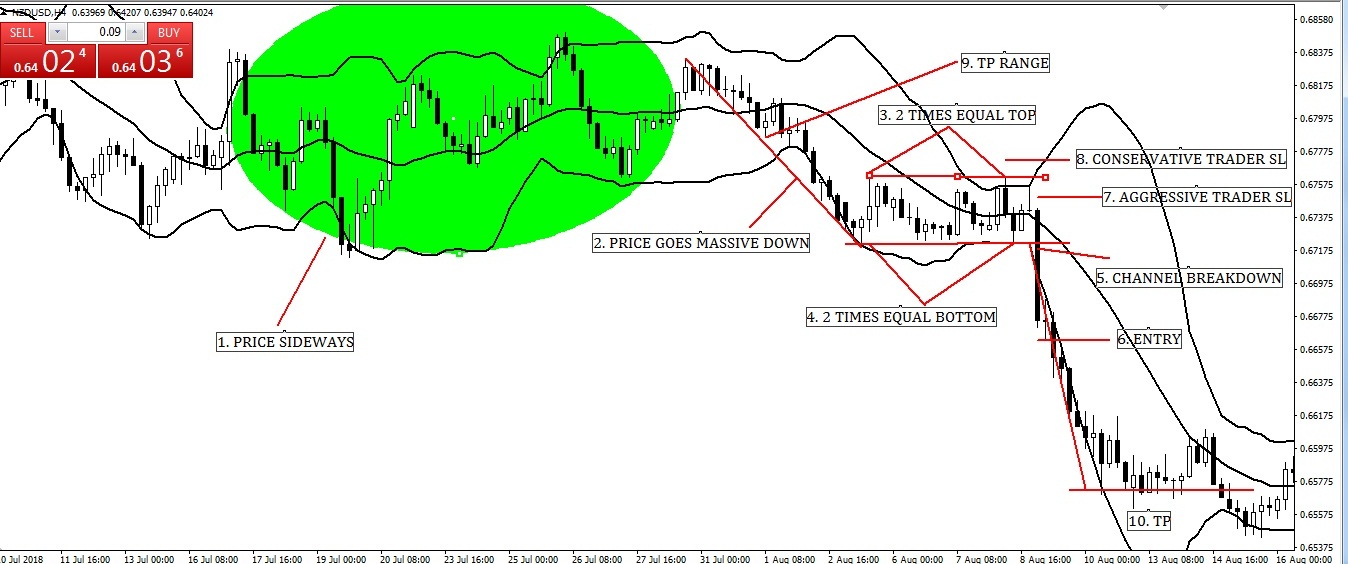
Bearish channel Pattern with Bollinger Bands Entry-Exit Strategy
Image point number – 1, We see candlesticks are sideways. Its time to wait and watch as
per Bearish channel Pattern with Bollinger Brand Entry-Exit Strategy rules.
Image point number – 2, Strong down trend created where price goes down massively.
Image point number – 3, After strong down trend price gone to reversal. Price created
two times parallel top.
Image point number – 4, Price created two times parallel bottom. We concretely found
bullish flag pattern in chart. Now we have to wait for break down.
Image point number – 5, At last price break down bearish channel pattern. As per Bearish
channel Pattern with Bollinger Brand Entry Exit Strategy rules its time to sell. But we have
to wait for candlesticks close below channel which indicate successful break down.
Image point number – 6, Aggressive or conservative trader put their SELL STOP order 2
pips below of Bearish channel Pattern break down candlesticks.
Image point number – 7, After hit SELL STOP order aggressive trader place STOP LOSS 2
pips above of Bearish channel Pattern break down candlesticks.
Image point number – 8, Conservative traders place STOP LOSS 2 pips above of Bearish
channel Pattern lower channel.
Image point number – 9, As per Bearish channel Pattern exit rules, we measure take
profit range.
Image point number – 10, Conservative or aggressive trader place their take profit level
on Bearish channel Pattern take profit range or near swing high or 1 : 2 or 1 : 3 risk reward
ratio.
——- Thanks for give your valuable time to read this article ——–
(To be continued)


