200 EMA and 20 EMA crossover Entry-Exit Strategy
200 EMA and 20 EMA crossover Entry-Exit Strategy Moving Average is Trend Indicator. There are various types of Moving averages. E.g. Simple Moving Average (SMA), Exponential Moving Average (EMA), Smoothed Moving Average (SMMA), etc.
Today we discuss the 200 Exponential Moving Average (EMA) and 20 Exponential Moving Average (EMA) crossover Entry-Exit strategies.
For your kind information, Any moving average strategy is a trend trading system.
Moving Average works well when prices are up to trend or downtrend.
In a choppy or sideways market moving average strategies are unable to well.
So we always avoid using moving average strategies when markets are choppy or sideways.
Otherwise, it’s chance to hit stop loss more and more.
Let’s discuss the 200 Exponential Moving Average (EMA) and 20 Exponential Moving Average (EMA) crossover Entry-Exit strategies.
At first, we need about what is Exponential Moving Average (EMA) is and the formula of Exponential Moving Average (EMA).
What is Exponential Moving Average (EMA)?
An exponential moving average (EMA) is a type of moving average (MA) that places a greater weight and significance on the most recent data points.
The exponential moving average is also referred to as the exponentially weighted moving average.
An exponentially weighted moving average reacts more significantly to recent price changes than a simple moving average (SMA), which applies an equal weight to all observations in the period.
Shortcut calculation of Exponential Moving Average (EMA):
Exponential Moving Average (EMA) = Price (T) X K + EMA (Y) X (1-k)
Where,
T= Today
Y= Yesterday
N= Number of Day in Exponential Moving Average
K= 2 / (N+1)
Don’t worry about the Exponential Moving Average critical calculation.
Exponential Moving Average is the default indicator in Metatrader4 or Metatrader5.
Metatrader4 Exponential Moving Average plot as below
Open Metatrader4 > Insert > Indicator > Trend > Moving Average> Exponential > OK
Let’s explore strategy:
We will take our BUY decision when the price is above 200 Exponential Moving Average.
Also, We will take our SELL decision when the price is below 200 Exponential Moving Average.
The 20 Exponential Moving Average (EMA) will use a pullback or pull-down strategy.
That means, We place Buy Limit or Buy Stop and Sell Limit or Sell Stop when price come back near, below, or touch 20 Exponential Moving Average (EMA)
BUY Rules:
>>> Assure that Price is just above the 200 Exponential Moving Average curve.
>>> 20 Exponential Moving Average crosses 200 Exponential Moving Average and it going up.
>>> Let’s wait for the price to come back near, below, or touch 20 Exponential Moving Average
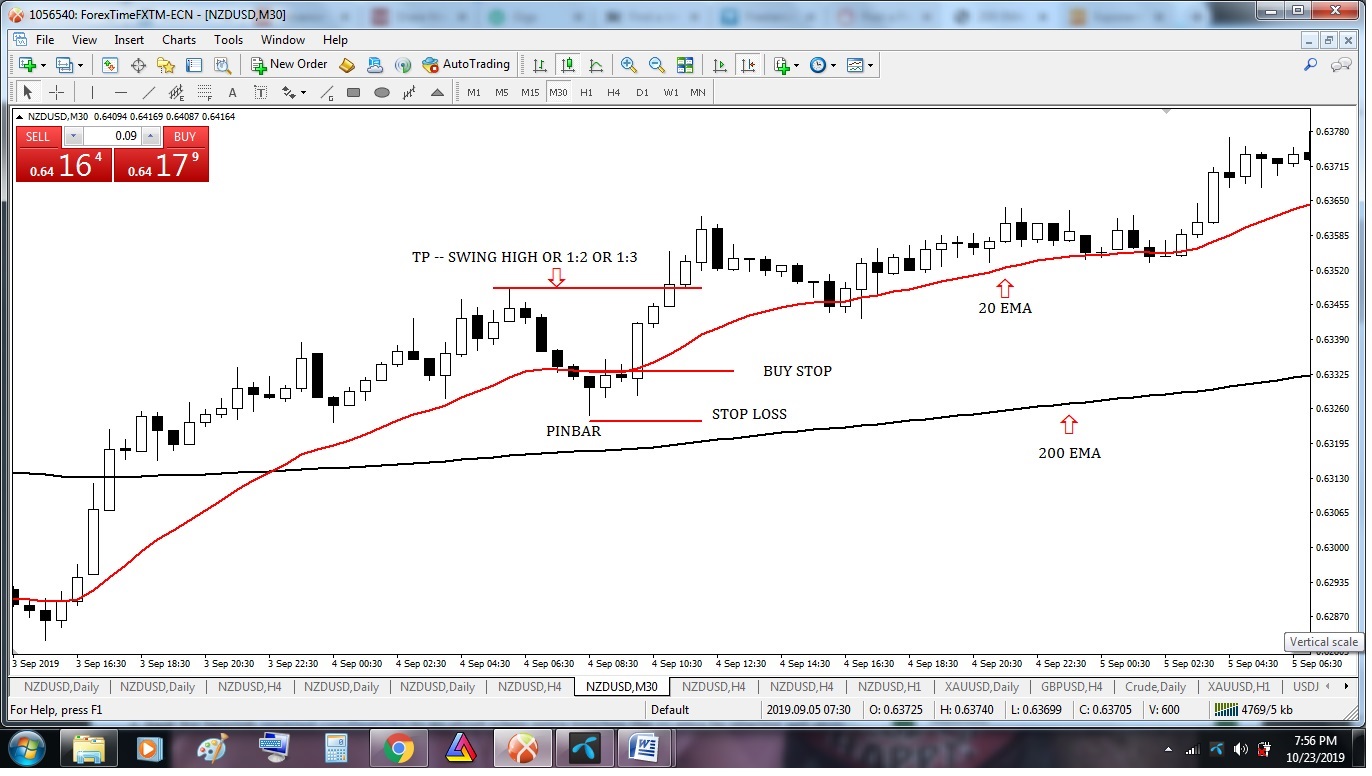
>>> Look for bullish price action reversal candlesticks pattern (PIN BAR, BULLISH ENGULFING, MORNING STAR, HAMMER, HARAMI, PIERCING, DOJI, etc.)
Entry: Place BUY STOP pending order at least two to five pips above of bullish price action reversal candlesticks.
Stop Loss: Two to five pips below of bullish price action reversal candlesticks or near swing low.
Take Profit: Take Profit will be near resistance / Swing High or 1:2 or 1:3 of risk-reward ratio.

Image 1: 200 Exponential Moving Average And 20 Exponential Moving Average crossover Entry and Exit (BUY).
SELL Rules:
>>> Assure that Price must be below the 200 Exponential Moving Average curve.
>>> 20 Exponential Moving Average crosses 200 Exponential Moving Average and it going down.
>>> Let’s wait for the price to come back near, below, or touch 20 Exponential Moving Average
>>> Look for bearish price action reversal candlesticks pattern (PIN BAR, BEARISH ENGULFING, SHOOTING STAR, HARAMI, DARK CLOUD COVER, DOJI, etc.)
Entry: Place SELL STOP pending order at least two to five pips below of bearish price action reversal candlesticks.
Stop Loss: Two to five pips above of bearish price action reversal candlesticks or near swing High.
Take Profit: Take Profit will be near Support / Swing Low or 1:2 or 1:3 of risk-reward ratio.

Image 2: 200 Exponential Moving Average And 20 Exponential Moving Average crossover Entry and Exit (SELL).
For your kind information, Every Strategy has a few Advantages and Disadvantages.
Let’s discuss the Advantages and Disadvantages of the 200 Exponential Moving Average And 20 Exponential Moving Average crossover strategy.
Advantages:
>>> This strategy is an easy and simple strategy. Also easy to understand and execute.
>>> In a trending market, it will give you a lot of pips if you execute this strategy properly.
>>> This strategy is also good as a swing trading strategy. You will entry and exit in a lot of time until the price crosses below 200 Exponential Moving Average (For BUY) and the price crosses above 200 Exponential Moving Average (For SELL).
>>> This strategy Risk Reward Ratio is also good.
Disadvantages:
>>> Exponential Moving Average is not a leading indicator. It’s a lagging indicator. For that reason, it provides a buy or sells signal lately. Price move so ahead thereafter Exponential Moving Average indicator gives us to buy or sell signal.
>> Choppy or Sideways market it’s don’t work. Also gave a lot of false signals which will affect your risk-reward ratio or strategy-wise profit loss statement. So it will be smart if you avoid a sideways market.
For your kind information, Ninety-Five percent of strategies gave a false signal in the sideways market.
200 Moving Average
———— Thanks for visit earnmoneyfx.com and read this article ————
 Earn Money Forex Best Forex Trading Experience


Having read this I thought it was very informative. I appreciate you spending some time and effort to put this short article together. I once again find myself personally spending way too much time both reading and leaving comments. But so what, it was still worthwhile.