Bollinger Band Strategies (Part-1) Friends……. Thanks a lot for visiting earnmoneyfx.com
This article earnmoneyfx.com research team try to cover one of the most uses indicators
various types of entry-exit strategy.
Let’s explore Bollinger Brand’s various types of Entry-Exit strategies.
Before entering a deep discussion about Bollinger Brand strategy, it’s important for us to know
what is Bollinger Brand and How to calculate Bollinger Band?
What is the Bollinger Band?
Bollinger Band was developed by John Bollinger. Bollinger Brand® is a registered
trademark by John Bollinger.
Bollinger Brand is very simple. It has three parts. Upper Brand, Middle Brand, and Lower
Brand.
Upper Brand and Lower Brand are volatility-based bands. Volatility based on standard
deviation. By using standard deviation volatility increases and decrease. Usually, standard
deviation 2 is set in the upper brand and lower brand.
When volatility increases the band automatically widen and when volatility decreases the
band automatically contract.
Middle Brand is 20 Simple Moving Average. Simple Moving Average use the standard
deviation formula thus 20 Simple Moving Average use Bollinger band as a middle brand.
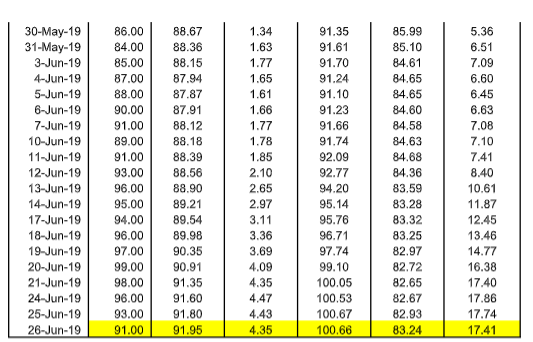
Calculation of Bollinger Band:
* Middle Band = 20-day simple moving average (SMA)
* Upper Band = 20-day SMA + (20-day standard deviation of price x 2)

now find out your Bollinger Band Strategies
Please note, Bollinger Band (20,2) is built-in the setup by Jhon Bollinger. But it’s not
mandatory to set up by build. You can change as your choice. But one thing you have to
know is that most of the trader’s setup Bollinger Brand as a build-in thus its show buy or signal
similarly most of the trader. If you want to change the build-in setup, at first you have to be specialists
in Bollinger Brand strategies. Otherwise more chance to hit stop loss. It will be best if you
are with the crowd.
As per John Bollinger suggestion,
You can set a standard deviation multiplier of 2, where the simple moving average is 20 and
The standard deviation value is 20.
You can set a standard deviation multiplier of 2.1, where the simple moving average is 50 and
The standard deviation value is 50.
You can set a standard deviation multiplier of 1.9, where the simple moving average is 10 and
The standard deviation value is 10.
How to set up Bollinger Band in Metatrader4:
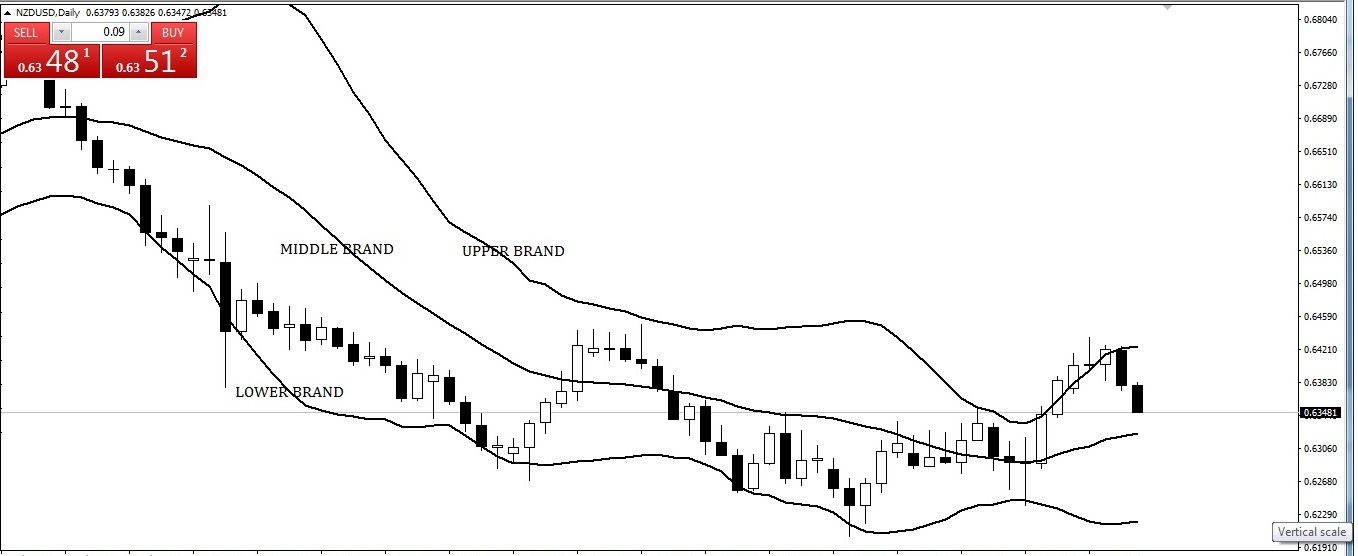
Open Metatrader4 > Insert >Indicator > Trend > Bollinger Band
Metatrader4 looks of Bollinger Band as below
Bollinger Band strategy
Various types Bollinger Band Entry-Exit strategy:
We can use various types of entry-exit strategies with the Bollinger band.
Earnmoneyfx.com research team suggest Bollinger Brand Entry-Exit strategy as below,
1. Candlesticks Pattern with Bollinger Band
2. Double Top Chart Pattern with Bollinger Band
3. Double Bottom Chart Pattern with Bollinger Band
4. Reversal or Counter Candlesticks with Bollinger Band
5. Trend line Breakout with Bollinger Band
6. Swing Trading with Middle Brand (20 Simple Moving Average) Bollinger Band
7. 200 Simple Moving Average with Bollinger Band
8. Walking with Bollinger Band etc.
Are you ready to explore all…….!
Just wait a second. Below information is very very important if you want to trade with
Bollinger Band entry exit strategy.
In Currency, Commodity and Stock market prices can up and down for many
reason.
When pricing up to and down aggressively then Bollinger Upper Band and Bollinger
Lower Band creates distance too far.
When price up to and down slowly within a rang then Bollinger Upper Band and
Bollinger Lower Brand comes near each other which calls SQUEEZE.
Remember, When the squeeze is created thereafter a great chance for BREAK OUT or
BREAK DOWN.
So we can idea about break out or break down by Bollinger Band previously.
Let’s EXPLORE one by one ………
Candlesticks Pattern with Bollinger Band:
Entry-Exit Strategy with Candlesticks and Bollinger Band
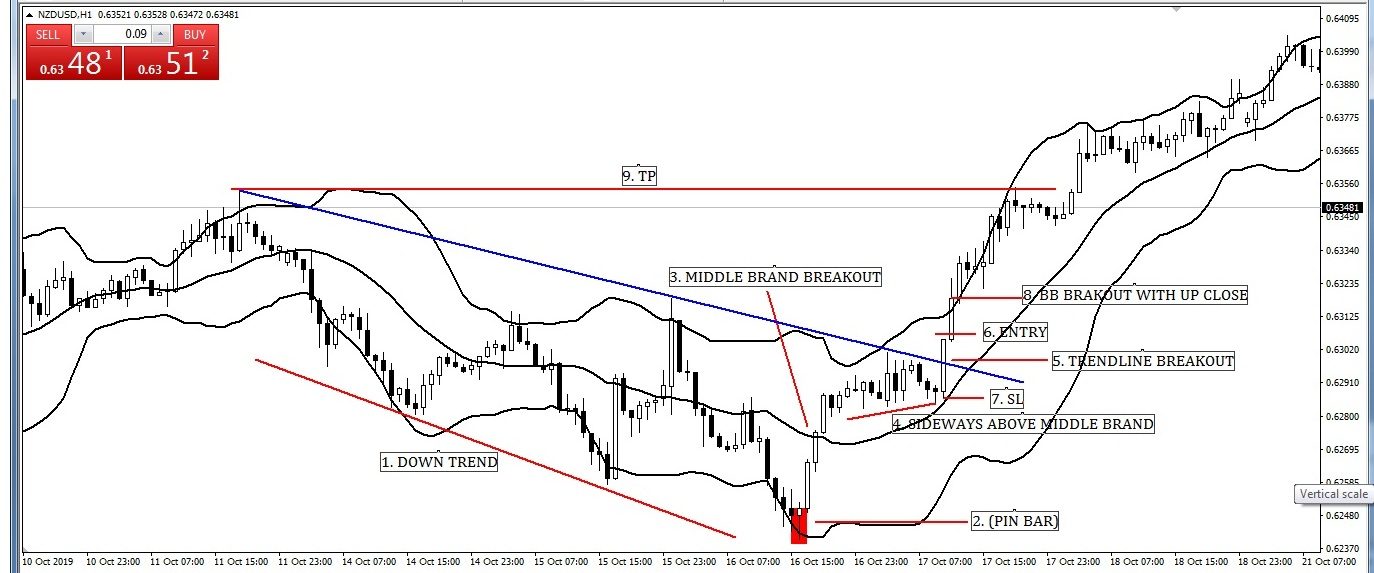
As above image point number – 1, we see prices are DOWN TREND. Also, the price goes down
with or close below Lower Bollinger Band.
Image point number – 2, Pin bar candlesticks created in a downtrend. That means the downtrend will end. But we don’t buy at this moment. We have to wait. If the price wants to complete
downtrend must breakout the middle band of the Bollinger band.
Image point number – 3, YAH……. Price wants to complete a downtrend. Its created
Bollinger Middle Brand breaks out candlesticks where price close above middle brand. Don’t
hurry, Till now we will not buy.
Image point number – 4, Sideways above middle brand that means bulls are still in
control. Though bears are trying to take control. It was BULL and BEAR fight time. Till now
we do not buy. We have to wait for who will win…… BULL or BEAR. Also, we draw a trend line.
Image point number – 5, After fifteen candlesticks fight with bull and bear …….. The bulls are winning. Also, it’s a breakout trend line.
Image point number – 6, We put our BUY STOP order 2 pips above of the trend line
breakout candlesticks.
Image point number – 7, After hit BUY STOP order we place STOP LOSS 2 pips below of
trend line breakout candlesticks.
Image point number – 8, Candlesticks breakout Bollinger Upper Band. Aggressive trader
entry here. Vice versa conservative traders buy
Image point number – 9, Conservative or aggressive traders place their take profit level
on the near swing high or 1: 2 or 1 : 3 risk-reward ratio.
Double Top Chart Pattern with Bollinger Band:
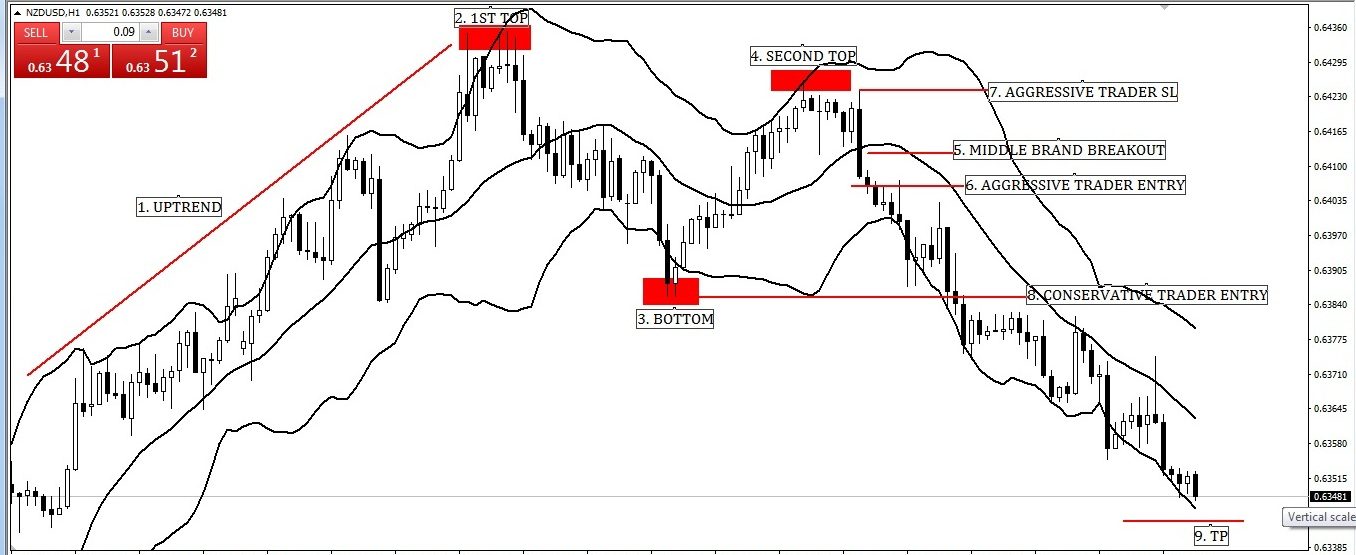
Double Top with Bollinger Band Entry-Exit Strategy
Image point number – 1, We see a strong uptrend of price with Bollinger Upper Band and
swing.
Image point number – 2, First top are created. Few candlesticks try to break the first top but
fail. When the price crosses below Bollinger Middle Band then we are sure that it’s the first top.
Image point number – 3, Thereafter a bottom has created which cross Bollinger Lower
Band and failure to the previous low. When price close above Bollinger Lower Band and
Bollinger Middle Brand then we will assure about our bottom.
Image point number – 4, Now we are waiting for another top (First top higher or lower
whatever no matter). Here second top created. Though Bulls try to break this top but
fail.
Image point number – 5, Thereafter price close below Bollinger Middle Band which
confirm us that it’s the second top.
Image point number – 6, Aggressive trader put their SELL STOP order 2 pips below of the
Bollinger Middle Brand breakout candlesticks.
Image point number – 7, After hit SELL STOP order aggressive trader place STOP LOSS 2
pips above of Bollinger Middle Band breakout candlesticks.
Image point number – 8, Conservative trader put their SELL STOP order 2 pips below of
the bottom candlesticks for breakdown confirmation.
Image point number – 9, Conservative or aggressive place their take profit level on near
swing low or 1: 2 or 1 : 3 risk-reward ratio.
——- Thanks for giving your valuable time to read this article ——–
(To be continued)
 Earn Money Forex Best Forex Trading Experience

