 Earn Money Forex Best Forex Trading Experience


Guide to using Bollinger Bands Explained
Bollinger Bands are popular technical analysis indicators often used for short-term trading for those looking to
try to capitalize and take profit from rising and falling trends in asset prices. Find out how Bollinger Bands work,
and how to start building your own Bollinger Band trading strategy.
Bollinger Bands as a Negating Indicator
It is always useful to run Bollinger bands on weekly, daily and intraday charts so
as to see where the market may be in relation to overall chart action. It is a rough
and ready indicator but it often provides some overall guidance with respect to
the potential reward and risk involved with a new trade.
Bollinger bands’ function of containment means that you have to be aware of
the risk for a new trade against the inside of an outer Bollinger band. As with overbought or oversold stochastics, this condition serves as a warning to evaluate
all factors rather than amounting to an embargo. When other factors such as
chart action confirm the likelihood of a breakout and follow-through, then these
indications may far outweigh this warning
What are Bollinger Bands?
Bollinger Bands were developed by John Bollinger (CMT, CFA).
They consist of three lines which are most commonly (not exclusively) overlaid on a securities price.
The middle line of the Bollinger Bands indicator is a moving average (usually) of the price (default is a 20-period moving average).
The upper Bollinger Band is derived from a standard deviation calculation of the price added to the moving average value.
The lower Bollinger Band is derived from a standard deviation calculation of the price subtracted from the moving average value

How do Bollinger Bands work?
The upper and lower Bollinger Bands create a channel type environment for the price and are expected to envelop the
price movements most of the time. The upper and lower Bollinger Bands provide a suggested range for the price dispersion and
in turn are a measure of price volatility.
The closer the bands are to each other (narrower), the lower the perceived volatility of the security in question at present.
For chartists, this would represent a period of consolidation or non-directional movement for the market is assessed.
The wider the bands are from each other, the higher the perceived volatility of the security in question at present.
If the bands are in the process of widening (which would be noted by the upper and lower bands pointing away from each other)
is often considered an indication that the early stages of a new directional price trend may be beginning or underway.
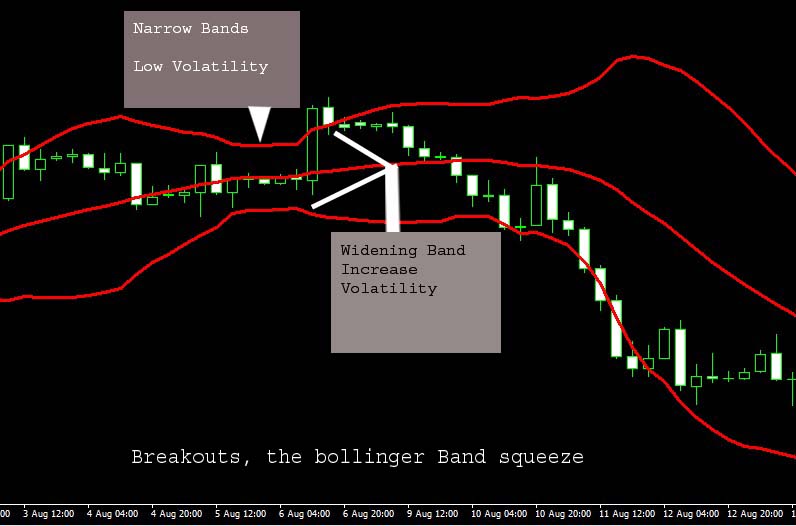
Breakouts, the Bollinger Band squeeze
As discussed earlier, Bollinger Bands help identify periods of low volatility indicative of consolidatory market environments.
Breakout traders will often look for these periods of consolidation and wait for the next trading opportunity to emerge from the consolidation.
Whilst the Bollinger Bands are narrowed, the upper band may be considered a point of resistance and the lower band a level of support.
Should the price break above the resistance or below the support of these bands, it may be considered a trading opportunity for breakout traders.
At this stage, the market could be transitioning from consolidation into a new price trend.
Breakout traders might use this as an entry opportunity for trading with this new trend.
A break of key support or resistance lines is often used in conjunction with the Bollinger Band break,
as confirmation signals before entering into the trade. It is also considered preferential
to see a sharp widening of the Bollinger Bands before entering into the trade.
The widening of the Bollinger Bands is further suggested that the price is now moving out of a
consolidation in into a new directional trend.

Bollinger Bands are not generally considered to provide target levels for trades,
although exit signals are sometimes considered when the bands stop widening or start to narrow once again.
The described Bollinger Breakout strategy is often referred to as the ‘Bollinger Squeeze’,
as the bands (in their narrowed form) look to squeeze the price before a breakout transpires.
Bollinger Bands for trend reversals
In addition to break out trading, Bollinger Bands are often used to help identify price trend reversals in the form of double tops
(‘M’) and double bottoms (‘W’). The use of Bollinger Bands for ‘M’ and ‘W’
signals looks to provide earlier indications than those produced
from conventional ‘M’ and ‘W’ chart patterns.
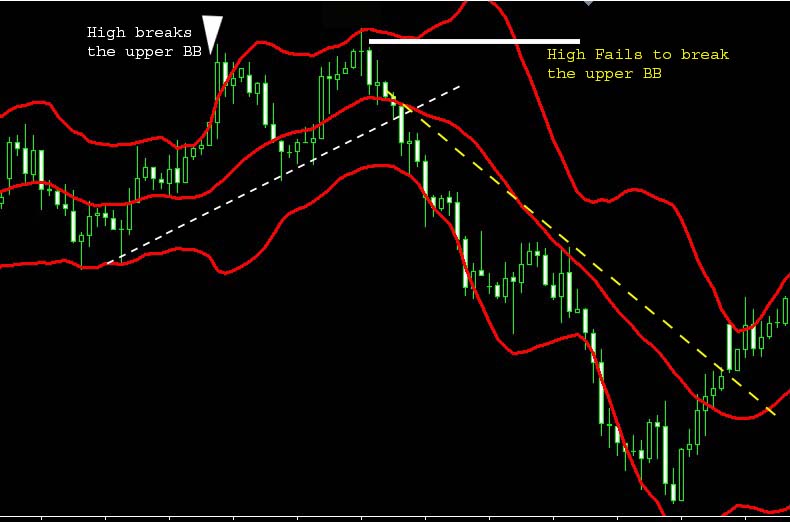
The ‘M’ reversal in Bollinger’s theory identifies two major price highs (significant turning points) after an uptrend.
The first major high is noted as having broken the upper Bollinger Band, while the second successive high falls short
of the upper Bollinger Band. The fact that the second price high does not break through the upper band, is a suggestion that
the momentum in price is now weaker (than the move to the previous price high) on a relative basis. This may be interpreted as a
type of overbought signal, suggesting that the trend up may have reached a short-term maturity and possibly setting up to reverse course.
Traders who are long in the market might consider this as a signal to bank profits or exit the trade. Traders who look to trade trend reversal patterns,
may wait for a trendline break or other technical indications for a confirmation signal before entering short into the market being evaluated.
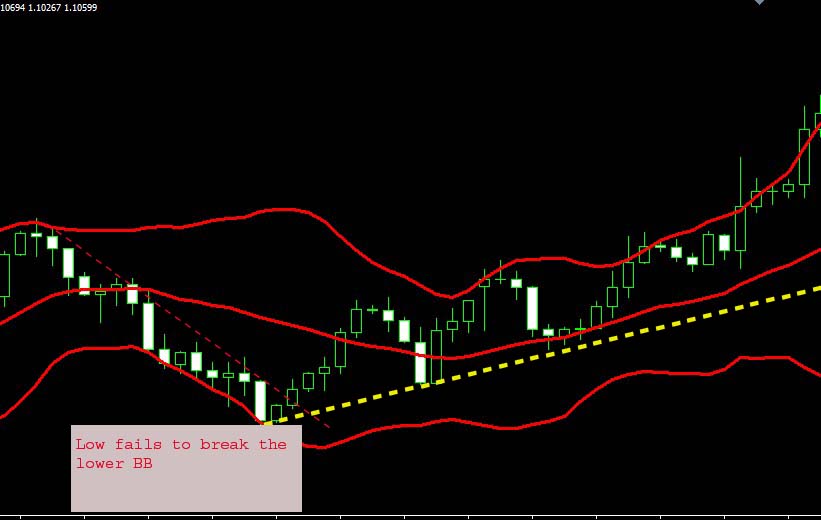
The ‘W’ reversal in Bollinger theory identifies two major price lows (significant turning points) after a downtrend.
The first major low is noted as having broken the lower Bollinger Band, while the second successive low falls short of the
lower Bollinger Band. The fact that the second price low does not break through the lower band, is a suggestion that the downward
momentum in price is now weaker (than the move to the previous price low) on a relative basis. This may be interpreted as a type of oversold signal,
suggesting that the trend down may have reached a short-term maturity and possibly setting up to reverse course.
Traders who are short in the market
might consider this as a signal to bank profits or exit the trade.
Traders who look to trade trend reversal patterns may wait for a trend line break or
other technical indications for a confirmation signal before entering long into the market being evaluated.
In summary
Bollinger Bands are popular indicators in technical analysis with several different applications
Widening Bollinger Bands suggest an increase in volatility
Narrowing Bollinger Bands suggest decreasing volatility
A ‘Bollinger Squeeze’ is a breakout trading strategy that accounts for volatility
Bollinger Bands are often used to help identify and trade trend reversals
An ‘M’ shaped pattern in Bollinger theory is considered a bearish reversal trade signal
A ‘W’ shaped pattern in Bollinger theory is considered a bullish reversal trade signal
Whichever your approach, Bollinger Bands make an interesting addition to a technical trading strategy which
can be used in isolation or with other indicators and price analysis techniques


