MACD (Moving Average Convergence/Divergence):
Moving Average Convergence/Divergence (MACD) is one of the
simplest and most reliable indicators on Forex. With MACD you’ll be
able to spot bull divergences and bear divergences which are rare and
effective patterns on Forex.
A – Bullish Divergence
When the price reaches a new low, and MACD can’t reach a new low,
there’s a bullish divergence which shows that the downtrend is losing
steam and an uptrend might be near. Here is an example:

In this chart, you can see an example similar to the one I showed you
when I talked about RSI. The price was at the same point as on the
previous bottom, while MACD was at a higher point.
After this bullish divergence, EUR/USD started an uptrend of more
than 1200 pips.
B – Bearish Divergences
When the price reaches a new high, and MACD can’t reach a new
high, there’s a bearish divergence which shows that the uptrend is
losing steam and a downtrend might be near. Here are some

On this chart, the EUR/USD reached a new high while MACD is below
the level it achieved on the previous top. This is a clear bearish
divergence.
This bearish divergence resulted in a strong downtrend of more than
700 pips.

Here is another bearish divergence. There’s a new high on EUR/USD
and MACD is at a lower level. As a result, EUR/USD started a nice
downtrend that lasted for 2 months.
MACD is not particularly good at identifying overbought and oversold
levels. Even though it is possible to identify levels that historically
represent overbought and oversold levels, MACD doesn’t have any
upper or lower limits to bind its movement. MACD can continue to
overextend beyond historical extremes.
C – Confirmation Indicator
You can also use MACD as a confirmation indicator.
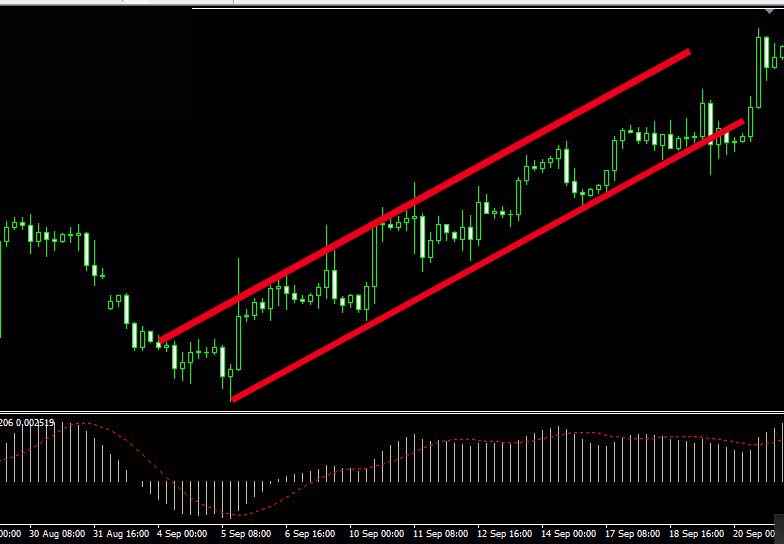
If MACD Histogram is above 0 this means we’re in an uptrend. If
MACD Histogram is below 0, we’re in a downtrend.
Using a cross above 0 or below 0 as a buy or sell signal respectively,
works well during strong trends, but when the market is choppy, this
the technique gives too many false signals. So, I only recommend using
MACD histogram above 0 or below 0 as a confirmation of other
indicators buy and sell signals.

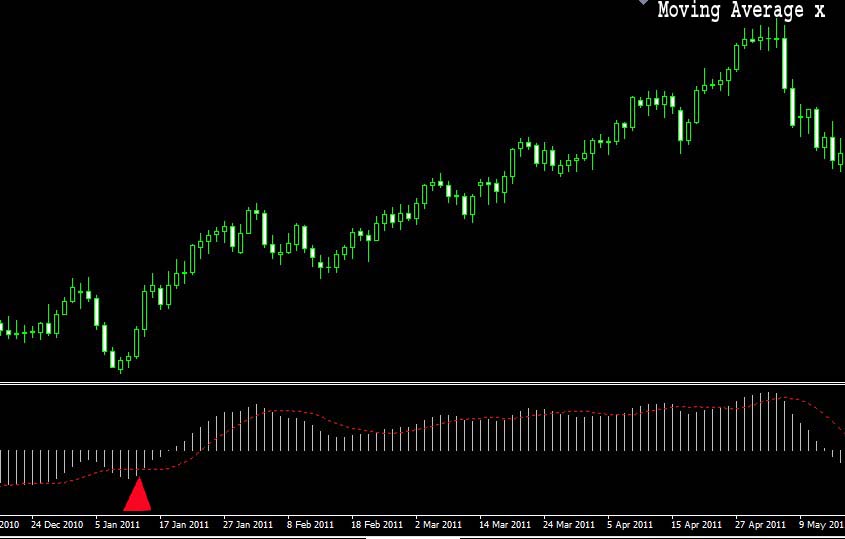
In this chart, you can see that a cross above 0 signaled a strong trend
that lasted 4 months and caught more than 700 pips profit. This kind
of signal works well during strong trends.

Unfortunately, during choppy markets, MACD gives too many false
signals as you can see on the above chart. That’s why I just use
MACD to spot divergences and to confirm trades. That’s the best way
to use MACD on any kind of market.
ATR Breakout Forex Trading Strategy
 Earn Money Forex Best Forex Trading Experience


